KNMI collects in-situ meteorological observations in the Netherlands aggregated into hourly, daily, monthly, and annual datasets. These data are derived from the 10-minute automatic measurements since the early 1990s, hourly observations from 1951, and daily observations from 1901. The earliest data starts in 1901 with one station and gradually increases to the current measurement network of more than 50 automatic weather stations.
The weather stations measure essential climate variables (ECVs), surface precipitation, pressure, global radiation, temperature, wind speed and direction, clouds, and visibility. Sunshine duration, water vapor and potential evapotranspiration are calculated from the ECVs. When applicable, minima, maxima, means, and sums are defined or calculated.
Purpose
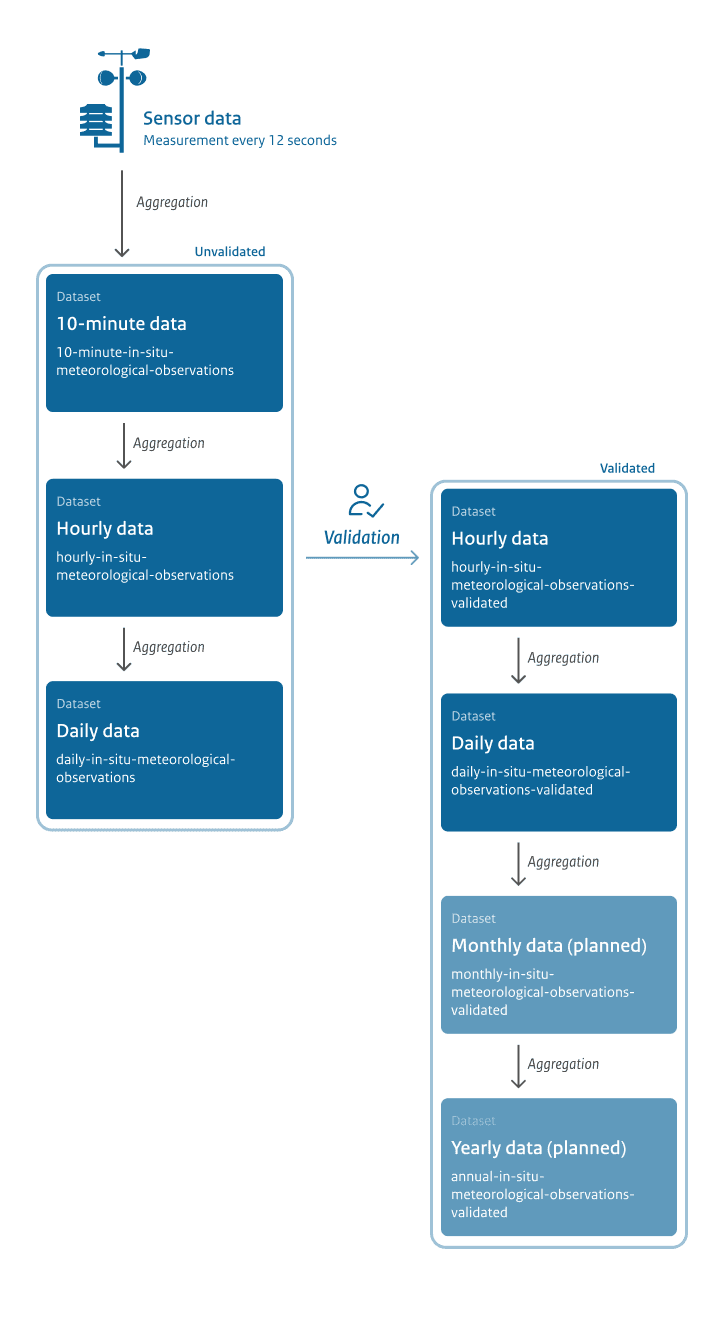
These datasets are meant to provide meteorological observations in the Netherlands. Distinction is made between quickly available hourly and daily datasets which have only passed operational quality control, and datasets which have passed through manual validation (see figure under "Data aggregation and validation flow", at the bottom of the page).
Using these datasets KNMI can calculate statistics to observe the climate in the Netherlands. Their use is not limited to climate science, and they are also intended for applications outside of meteorology or climatology.
Because of station relocations and changes in observation techniques, the data in these datasets are inhomogeneous. As a result, these series are not suitable for trend analysis. For climate change studies we refer to the homogenized daily temperature data of the five principal stations in the Netherlands or the updated monthly timeseries of the Central Netherlands Temperature. Trend analyses are presented in KNMI’23 Climate Scenario’s.
Time
Timestamps in the file and filename are stored in UTC. For the Netherlands, local time is UTC+1 (CET) and during daylight saving times local time is UTC+2 (CEST).
The timestamp in the files indicates the end of the measuring interval preceding that timestamp. The filenames use an abbreviated timestamp indicating the total interval. See the table below for examples.
Individual variables may be measured and aggregated over a different time interval. This can be shorter than the interval of the file. This is denoted in the description of the variable and the `measurementType.duration` field of the EDR metadata.
| Type | Aggregation period | Filename | NetCDF and EDR |
|---|---|---|---|
| Hourly | 2025-01-02T23:00:00Z 2025-01-03T00:00:00Z | hourly-observations-20250102-23.nc | 2025-01-03T00:00:00Z |
| Daily | 2025-01-02T00:00:00Z 2025-01-03T00:00:00Z | daily-observations-20250102.nc | 2025-01-03T00:00:00Z |
| Monthly | 2024-12-01T00:00:00Z 2025-01-01T00:00:00Z | monthly-observations-202412.nc | 2025-01-01T00:00:00Z |
| Annual | 2024-01-01T00:00:00Z 2025-01-01T00:00:00Z | annual-observations-2024.nc | 2025-01-01T00:00:00Z |
Availability
The unvalidated hourly and daily datasets are updated on a nightly basis with data from the preceding day. Validated hourly and daily datasets are updated during working days and can be delayed up to 10 working days. Validated data can be modified at any moment in the future if further issues are found with the data.
Monthly and yearly datasets are updated after all days in their respective period have been validated and can receive further updates up to months later.
It is highly recommended to use the MQTT Notification Service to be notified when the dataset receives new or updated files, to always get the latest data without unnecessary polling or redownloading.
The datasets are available as NetCDF files. The files can be downloaded via the Open Data API. The datasets are also available as an Environmental Data Retrieval (EDR) collection. The EDR API makes it possible to query the dataset on specific variables in a spatio-temporal manner, without requiring the user to download full datasets.
Stations
The stations in these datasets are part of the WMO Integrated Global Observing System (WIGOS). The datasets contain the location, name, and the WIGOS identifier of each station.
A historical record of some of the station metadata is kept in the weather stations dataset on the Data Platform. More metadata and information about the stations can also be found in the WMO OSCAR database.
The unvalidated hourly and daily datasets contain both observations from the Netherlands as well as the Caribbean Netherlands (BES islands).
Aggregation methods
Observations from sensors located at Automatic Weather Stations are processed into time series of 10-minute intervals. From these 10-minute intervals the data is subsequently aggregated to hourly, daily, monthly and annual intervals. Aggregated values can only be calculated if data availability of the underlying datasets allow for it.
The methodology for aggregating depends on the variable and can vary. For example: Daily mean pressure is calculated as a mean of the 24 pressure values of that day (midnight to midnight UTC). The monthly maximum wind gust is calculated as the maximum of the daily maximum wind gust values of all days in that month, which in turn are the maximum wind gust values of the 24-hourly wind gust maxima (midnight to midnight UTC).
Manual validation process
The hourly data is thoroughly validated by KNMI experts. The quality of the data is assessed based on various criteria. Data is also compared with neighbouring stations and assessed based on the expertise of the validation team. If deviations are found, the data is corrected.
Manual validation is carried out during office hours and may also take place in non-chronological order. In some cases, validation can take up to 30 working days. The exact availability of each dataset can be found in the table under “List of datasets”.
Reasons for correction include:
Missing data
In the case of missing data points, 100% completeness is guaranteed for temperature, solar radiation and precipitation for all land stations. Other variables are supplemented as long as quality can be guaranteed. For example, in the event of a prolonged sensor malfunction, a variable cannot always be supplemented.
Measurement errors
Measurement errors can arise due to faulty sensors, calibration problems or temporary malfunctions in the measuring equipment. These errors are detected by internal quality controls and by comparison with nearby measuring stations. Where possible, incorrect values are corrected or replaced.
Sensor drift
Sensor drift occurs when a sensor gradually starts to measure deviating values over time, for example due to ageing or wear and tear. This type of deviation is identified through long-term analyses and periodic checks, after which corrections are applied or the sensor is replaced.
Undesirable environmental influences
Environmental factors may temporarily differ, resulting in unreliable measurements. This is prevented as much as possible by the placement of the stations, but cannot always be avoided. This may concern maintenance, but animals or vehicles (e.g. helicopters at a drilling platform) can also influence measurements.
| Name | Period | Availability | Validated | Published |
|---|---|---|---|---|
| Hourly | Overnight | ✔️ | ||
| Hourly | 1-10 working days | ✔️ | ✔️ | |
| Daily | Overnight | ✔️ | ||
| Daily | 1-10 working days | ✔️ | ✔️ | |
|
monthly-in-situ-meteorological-observations-validated | Monthly | 1-10 working days after the end of the period | ✔️ | |
|
annual-in-situ-meteorological-observations-validated | Annual | 1-10 working days after end of period | ✔️ | |
|
daily-manual-precipitation-observations | 24 hours (8 AM – 8 AM) | Throughout the subsequent day | ||
| daily-manual-precipitation-observations-validated | 24 hours (8 AM – 8 AM) | 1-30 days working days after end of period | ✔️ |
| Parameter | Description | Unit | Observed property | Comment |
|---|---|---|---|---|
| DD | Past 10 minute mean wind direction, representative for 10 meters, in degrees; 360=north; 90=east; 180=south; 270=west; 0=calm; 990=variable | ° | Wind from direction | |
| DR | Hourly precipitation duration, in hours | h | Duration of precipitation | |
| EE | Hourly mean vapor pressure, in hectopascal | hPa | Water vapor partial pressure in air | |
| FF | Past 10 minute mean wind speed, representative for 10 meters, in meters per second | m/s | Wind speed | |
| FH | Hourly mean wind speed, representative for 10 meters, in meters per second | m/s | Wind speed | |
| FX | Hourly maximum wind gust, representative for 10 meters, in meters per second | m/s | Wind speed of gust | |
| IX | Hourly indicator present weather code; 1=manned and recorded (using code from visual observations); 2; 3=manned and omitted (no significant weather phenomenon to report; not available); 4=automatically recorded (using code from visual observations); 5; 6=automatically omitted (no significant weather phenomenon to report; not available); 7=automatically set (using code from automated observations) | 一 | Indicator present weather code | |
| N | Past 10 minute cloud cover, in okta; 9=sky invisible | okta | Cloud area fraction | |
| P | Past 1 minute mean air pressure at sea level | hPa | Air pressure at mean sea level | |
| Q | Hourly global solar radiation, in joules per square centimeter | J/cm² | Integral wrt time of surface downwelling shortwave flux in air | |
| RH | Hourly precipitation amount, in millimeters | mm | Precipitation amount | *1 |
| SQ | Hourly sunshine duration, calculated from global solar radiation, in hours | h | Duration of sunshine | *2 |
| T | Past 1 minute air temperature at 1.50 meters, in degrees Celsius | °C | Air temperature | |
| T10N | Past 6 hour minimum air temperature at 10 centimeters, in degrees Celsius | °C | Air temperature | |
| TD | Past 1 minute dew point temperature at 1.50 meters, in degrees Celsius | °C | Dew point temperature | |
| U | Past 1 minute relative atmospheric humidity at the time of observation, at 1.50 meters, as percentage | % | Relative humidity | |
| VV | Past 10 minute horizontal visibility; 0=less than 100m; 1=100-200m; 2=200-300m;...; 49=4900-5000m; 50=5-6km; 56=6-7km; 57=7-8km; ...; 79=29-30km; 80=30-35km; 81=35-40km;...; 89=more than 70km | 一 | Visibility in air | |
| W1 | Hourly indicator of fog; 0=no occurrence; 1=occurred | 一 | Fog | |
| W2 | Hourly indicator of rainfall; 0=no occurrence; 1=occurred | 一 | Rain | |
| W3 | Hourly indicator of snow. 0=no occurrence; 1=occurred | 一 | Snow | |
| W5 | Hourly indicator of thunder. 0=no occurrence; 1=occurred | 一 | Thunder | |
| W6 | Hourly indicator of ice formation. 0=no occurrence; 1=occurred | 一 | Ice formation | |
| WW | Hourly present weather code, aggregated with an algorithm using 10-minute ww (WaWa) values from the preceding 6 hours; WMO table 4680 | 一 | Present weather code |
*1: For precipitation amounts the detection minimum is 0.05 millimeters.
*2: For sunshine duration the measured minimum is 0.05 hours.
| Parameter | Description | Unit | Observed property | Comment |
|---|---|---|---|---|
| DDFHX | Wind direction in hourly interval in which FHX was measured | ° | Wind from direction | |
| DDVEC | Daily vector mean wind direction, representative for 10 meters, in degrees. Wind direction has been weighted with wind speed during aggregation. 360=north; 90=east; 180=south; 270=west; 0=calm/variable | ° | Wind from direction | |
| DR | Daily precipitation duration, in hours | h | Precipitation Duration | |
| EEG | Daily mean vapor pressure, in hectopascal | hPa | Water vapor partial pressure in air | *1 |
| EV24 | Potential evapotranspiration (Makkink) | mm | Water potential evapotranspiration amount | |
| FG | Daily mean wind speed, representative for 10 meters, in meters per second | m/s | Wind speed | |
| FHN | Daily minimum hourly wind speed, representative for 10 meters, in meters per second | m/s | Wind speed | |
| FHNH | Hourly interval in which FHN was measured | 一 | Hourly interval in which | |
| FHVEC | Daily vector mean wind speed, representative for 10 meters, in meters per second | m/s | Wind speed | |
| FHX | Daily maximum hourly wind speed, representative for 10 meters, in meters per second | m/s | Wind speed | |
| FHXH | Hourly interval in which FHX was measured | 一 | Hourly interval in which | |
| FXX | Daily maximum wind gust, representative for 10 meters, in meters per second. Highest 3 second average of the day | m/s | Wind speed of gust | |
| FXXH | Hourly interval in which FXX was measured | 一 | Hourly interval in which | |
| NG | Daily mean cloud cover, in okta. 9=sky invisible | okta | Cloud area fraction | *2 |
| PG | Daily mean sea level pressure, in hectopascal | hPa | Air pressure at mean sea level | *1 |
| PN | Daily minimum mean sea level pressure, in hectopascal | hPa | Air pressure at mean sea level | *1 |
| PNH | Hourly interval in which PN was measured | 一 | Hourly interval in which | *1 |
| PX | Daily maximum hourly mean sea level pressure, in hectopascal | hPa | Air pressure at mean sea level | |
| PXH | Hourly interval in which PX was measured | 一 | Hourly interval in which | |
| Q | Daily global solar radiation, in joules per square centimeter | J/cm² | Integral wrt time of surface downwelling shortwave flux in air | |
| RH | Daily precipitation amount, in millimeters | mm | Precipitation amount | *3 |
| RHX | Daily maximum hourly precipitation amount | mm | Precipitation amount | *3 |
| RHXH | Hourly interval in which RHX was measured | 一 | Hourly interval in which | |
| SP | Daily percentage of potential sunshine duration | % | Duration of sunshine | |
| SQ | Daily sunshine duration in hours, calculated from global solar radiation | h | Duration of sunshine | *4 |
| T10N | Daily minimum air temperature at 10 centimeters above surface, in degrees Celsius | °C | Air temperature | |
| T10NH | 6-hourly interval in which T10N was measured; 6=0-6 UTC; 12=6-12 UTC; 18=12-18 UTC; 24=18-24 UTC | 一 | Six hourly interval in which | |
| TG | Daily mean air temperature at 1.50 meters, in degrees Celsius | °C | Air temperature | *1 |
| TN | Daily minimum air temperature at 1.50 meters, in degrees Celsius | °C | Air temperature | |
| TNH | Hourly interval in which TN was measured | 一 | Hourly interval in which | |
| TX | Daily maximum air temperature at 1.50 meters, in degrees Celsius | °C | Air temperature | |
| TXH | Hourly interval in which TX was measured | 一 | Hourly interval in which | |
| TZG | Daily mean sea temperature in degrees Celsius | °C | Sea water temperature | |
| UG | Daily mean relative atmospheric humidity | % | Relative humidity | *1 |
| UN | Daily minimum relative atmospheric humidity | % | Relative humidity | *1 |
| UNH | Hourly interval in which UN was measured | 一 | Hourly interval in which | |
| UX | Daily maximum relative atmospheric humidity | % | Relative humidity | *1 |
| UXH | Hourly interval in which UX was measured | 一 | Hourly interval in which | |
| VVN | Daily minimum visibility; 0: <100 m; 1:100-200 m; 2:200-300 m; ...; 49:4900-5000 m; 50:5-6 km; 56:6-7 km; 57:7-8 km;...; 79:29-30 km; 80:30-35 km; 81:35-40 km;...; 89: >70 km | 一 | Visibility in air | *2 |
| VVNH | Hourly interval in which VVN was measured | 一 | Hourly interval in which | |
| VVX | Daily minimum visibility; 0: <100 m; 1:100-200 m; 2:200-300 m; ...; 49:4900-5000 m; 50:5-6 km; 56:6-7 km; 57:7-8 km;...; 79:29-30 km; 80:30-35 km; 81:35-40 km;...; 89: >70 km | 一 | Visibility in air | *2 |
| VVXH | Hourly interval in which VVX was measured | 一 | Hourly interval in which | |
| W1 | Daily number of hourly intervals in which fog was measured | # | Fog | |
| W2 | Daily number of hourly intervals in which rain was measured | # | Rain | |
| W3 | Daily number of hourly intervals in which snow was measured | # | Snow | |
| W5 | Daily number of hourly intervals in which a thunderstorm was measured | # | Thunder | |
| W6 | Daily number of hourly intervals in which ice formation was measured | # | Ice formation |
*1: The derived value has been calculated from the hourly timeseries. For this variable the hourly timeseries reflects the measurements in the 1 min up to the whole hour, not all samples measured over the whole period.
*2: The derived value has been calculated from the hourly timeseries. For this variable the hourly timeseries reflects the measurements in the 10 min up to the whole hour, not all samples measured over the whole period.
*3: For precipitation amounts the detection minimum is 0.05 millimeters.
*4: For sunshine duration the measured minimum is 0.05 hours.